
GIS · GEOSPATIAL · LOCATION INTELLIGENCE
What is GIS? Geographic Information Systems explained
A GIS, or Geographic Information System, is a system that captures, stores, analyses and visualises data linked to a position on the territory. It is the technology that turns data into maps — and maps into answers. This guide, written by the Geograma team, explains how GIS works, what it is made of, and how governments and companies use it today.
- 80%of all information has a spatial component*
- 5components make up a GIS
- 2data models: vector and raster
- 1998Geograma has worked with GIS ever since
* An estimate widely cited across the geospatial industry.
DEFINITION
A GIS is much more than a digital map
A map shows where something is. A Geographic Information System goes further: it links every element on the map to a database — attributes, dates, conditions, measurements — and lets you query, combine and analyse it. That is why we call it a system: it brings together hardware, software, data, people and methodology to manage geolocated information end to end.
You may also come across the Spanish acronym SIG (Sistema de Información Geográfica) — it is exactly the same thing. On top of this technological foundation sits Location Intelligence: the use of location data to drive business and public-management decisions.
An effective GIS, moreover, is not just software: it is the balance of technology, data and processes, governed by a strategy. Technology provides the tools; data supplies the information; processes turn that information into knowledge for decision-making. If one of the three legs fails — powerful technology without quality data, good data without clear processes, well-defined processes without the right technology — the system loses effectiveness.
The questions a GIS answers
- What is here? An inventory of what exists at a point or in an area.
- Where does it happen? Locating a phenomenon: congestion, leaks, incidents.
- What has changed? How the territory evolves over time.
- What patterns exist? Clusters, correlations, trends.
- What if…? Simulating scenarios before deciding.
COMPONENTS
The 5 components of a GIS
A GIS only works when these five pieces are aligned. Technology is the visible part; data and method are what make the difference.
Hardware
Computers and servers, on-premise or in the cloud, where the system runs: from a single technical workstation to scalable cloud platforms.
Software
Programs to receive data, manage it in spatial databases, analyse it and visualise it: ArcGIS, QGIS, WebGIS platforms…
Geographic data
The fuel of GIS. Data captured in the field or supplied by third parties: base mapping, LiDAR, imagery, traffic data…
People
Surveyors, geographers, analysts and developers who capture, model, program and interpret the information.
Methodology
The procedures that define how information is captured, validated, updated and exploited in each organisation.
HOW IT WORKS
How does a GIS work? The territory, in layers
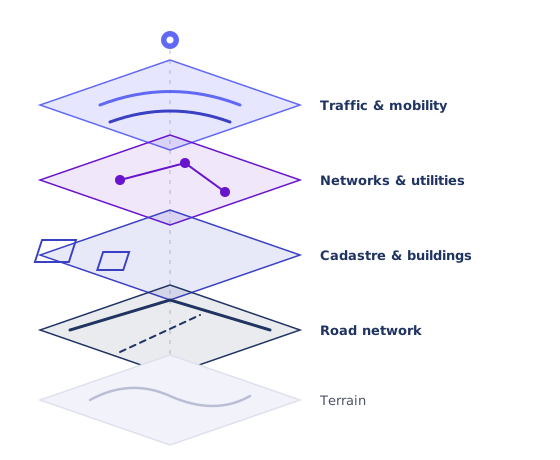
The core idea of GIS is the layer: each type of information — parcels, roads, water networks, traffic, population — is stored as an independent layer, all georeferenced over the same territory. Overlaying them answers questions no single layer can answer on its own: which parcels sit within 300 metres of a future tram line, or which network sections coincide with the areas of highest demand.
In practice, a GIS project follows five stages:
- Define the problem and design the roadmap: what question must be answered and what data is needed.
- Capture and integrate the data: fieldwork, existing sources, third-party data.
- Structure the geographic database: georeference, model, control quality.
- Analyse: overlay layers, compute, detect patterns and draw conclusions.
- Publish the result: maps, web viewers, dashboards or services consumed by other systems.
THE DATA
Where does GIS data come from?
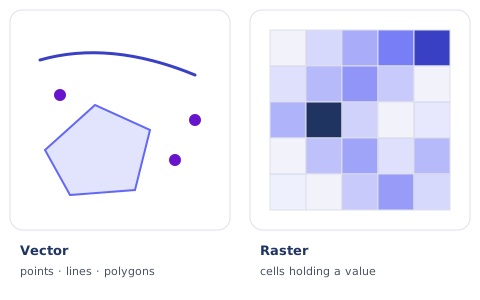
Geographic information is represented in two models — vector (points, lines and polygons with attributes) and raster (grids of cells holding a value, like a satellite image) — and is captured through increasingly diverse channels:
Field capture
Classic surveying and GNSS, Mobile Mapping (vehicles equipped with cameras and sensors that survey streets and roads with precision) and LiDAR, which generates 3D point clouds of the territory.
Sensors and imagery
Aerial and satellite imagery, drones, and smart-city IoT sensors: cameras, loops and environmental stations continuously feeding the GIS.
Third-party data
Official mapping and cadastre, digital maps and location APIs, and connected-vehicle data (Floating Car Data) from providers such as TomTom or HERE, which Geograma integrates into traffic and mobility projects.
SPATIAL ANALYSIS
What can you do with a GIS?
APPLICATIONS
What is GIS used for? Applications by sector
Infrastructure, public space and mobility
Traffic studies with real connected-vehicle data, inventory and maintenance of road and public-space assets, urban and interurban mobility.
Smart cities and urban planning
Citizen map viewers, planning, urban growth analysis, management of municipal services: inventories, corrective and preventive maintenance, across the territory they manage. Indicator tracking for compliance with local action plans and the 2030 Agenda.
Land management and environment
Territorial planning, pollution monitoring, forestry and water-cycle management, natural risk assessment.
Real estate, valuation and fintech
Cadastre–registry coordination, graphic validation, boundary surveys, land and property management, valuation and fintech.
Energy
Planning, operation and maintenance of energy infrastructure and utility networks; siting of renewable energy.
Architecture, engineering and construction
GIS/BIM integration in projects, the territorial context of construction works, digital twins of buildings and infrastructure.
Industry
Industrial digitalisation with indoor mapping and 3D modelling of plants and facilities.
Security, defence and emergencies
Decision support in critical contexts: emergency response, roadside assistance, resource planning.
Marketing and advertising (OOH)
Geomarketing and out-of-home advertising: geospatial audience analysis to plan and optimise campaigns.
Ports, transport, logistics and last mile
Location Intelligence to optimise routes and fleets, last-mile distribution and the planning of logistics and port platforms.
Explore in detail the sectors Geograma works in.
THE PLATFORM
GeoStreet®: from the technical GIS to the whole organisation
A GIS reaches maturity when it stops being a specialists' tool and anyone in the organisation — or any citizen — can use it from the browser. For that leap, Geograma implements GeoStreet®, its no-code platform for creating and publishing webGIS applications without writing a single line of code: import geographic data, connect real-time sources, organise layers and base maps, build custom analyses and dynamic dashboards, and publish HTML5 interfaces accessible from any device.
GeoStreet® works with open formats and OGC and INSPIRE standards, without locking your data into proprietary formats. And deployment adapts to each organisation: on the client's own infrastructure or as a managed service on GeoServicios® Cloud, Geograma's geographic hosting on public, private or hybrid cloud, with sizing, maintenance, security and performance handled by our team.
RELATED CONCEPTS
GIS vs GPS, remote sensing, BIM and Location Intelligence
| Technology | What it is | How it relates to GIS |
|---|---|---|
| GPS / GNSS | Satellite positioning system: it tells you where you are. | A data source. The GIS stores, manages and analyses the positions the GPS captures. |
| Remote sensing | Observing the territory with remote sensors (satellite, aircraft, drone). | It produces imagery and raster data that the GIS integrates as information layers. |
| Digital cartography | Representing the territory in digital maps. | One of the products of a GIS; the system adds the database and the analysis. |
| BIM | Building Information Modelling, focused on the building or the construction work. | Complementary: BIM models the asset, GIS its territorial context. They converge in digital twins. |
| Location Intelligence | Using location data for business and management decisions. | The value layer on top of GIS: it turns spatial analysis into indicators for decision-making. |
REAL CASES
GIS in action: Geograma projects
GeoBilbao
A municipal web viewer that brings Bilbao's geographic information to its citizens: cartography, planning and urban services available from the browser.
GeoTraffic · Gothenburg
Traffic management for the Swedish city using connected-vehicle data (FCD), analysing circulation with real, continuous information.
Toluca–Mexico City Interurban Train
Georeferencing of a major railway infrastructure, with precise 3D topographic data for its construction and management.
See more projects in Geograma's success stories.
WHO IS IT FOR
Who uses GIS?
Public administrations
City councils, regional and national governments: urban and territorial planning, environment, cadastre, security and emergencies, citizen services and the monitoring of local action plans and the 2030 Agenda.
Infrastructure and energy managers
Roads, railways, ports, utilities and energy companies that need to inventory, maintain and operate their assets across the territory.
Consultancies, engineering and architecture firms
Traffic and mobility studies, civil engineering, urban planning and architecture and construction projects that need reliable data, GIS/BIM integration and tools for their work.
Private companies
Real estate, valuation and fintech; industry; logistics and last mile; marketing and out-of-home (OOH) advertising; retail, banking and insurance: any business where location shapes the decision.
WHY GEOGRAMA
Geographic Intelligence specialists since 1998
The full data cycle
From field capture — Mobile Mapping, LiDAR, surveying — to processing, the database and the final application. No external links in the chain to dilute quality.
GIS development and integration
We build custom applications and viewers and integrate data and services from providers such as TomTom or HERE. Geograma is a NavPro company, certified under ISO 9001, 27001, 45001 and 14001.
A partner, not a competitor
Geograma does not do traffic or mobility consultancy or engineering: consultancies and engineering firms are our clients. We give them the data and the technology to measure, justify and defend every decision.
FAQ
Frequently asked questions about GIS
Are GIS and SIG the same thing?
Yes. GIS is the English acronym (Geographic Information System) and SIG the Spanish one (Sistema de Información Geográfica). Professionally and in most tools, GIS is the standard term, but they refer to exactly the same technology.
What is the difference between GIS and GPS?
GPS is a positioning system: it tells you which coordinate you are at. GIS is the information system that stores, manages and analyses those positions together with many other data. GPS is one of the sources that feed a GIS.
What GIS software is there?
The most widespread are ArcGIS (Esri), under commercial licence, and QGIS or gvSIG, which are free and open source. Add to these spatial databases such as PostGIS and WebGIS platforms for publishing maps and viewers on the web. The choice depends on the project; at Geograma we work across these technologies and integrate the one that fits each case best.
Is QGIS enough for my organisation?
To get started, yes: QGIS is a powerful, flexible open-source tool, ideal for desktop use. Its limits appear as you grow: in a monolithic architecture the data lives locally or on a network drive, and it does not support managing information across the intranet or publishing it to citizens. The next level is a client/server architecture with a spatial database (PostgreSQL + PostGIS); and to reach a non-technical audience, a WebGIS architecture with platforms such as GeoStreet®. Mature organisations typically combine all three levels.
Open-source or commercial GIS software?
Open source (QGIS, PostGIS, GeoServer…) removes licence costs and offers maximum flexibility and vendor independence, in exchange for a larger development effort and support that depends on the community or on specialised providers. Commercial software brings fast implementation, official support and continuous updates, with licence costs and a degree of vendor dependence. In many projects the best solution is hybrid: commercial software for critical tasks and open source for specific analyses. Geograma works with both approaches and prescribes the one that fits each case best.
What is Location Intelligence?
It is the exploitation of location data to make decisions: combining GIS analysis with business or public-service data to answer where to invest, how to size a service or which scenario to choose. GIS is the technological foundation; Location Intelligence is the value extracted from it.
What data does a GIS need?
It depends on the goal: base mapping, cadastre, asset inventories, LiDAR point clouds, aerial or satellite imagery, sensor data or connected-vehicle traffic data… What matters is that the data is georeferenced, up to date and quality-controlled. Much of a GIS project's success is decided in data capture and processing.
Are GIS and BIM compatible?
Yes, and increasingly so. BIM models the building or construction work in detail; GIS provides the territorial context: parcel, networks, access, surroundings. Integrating both is the basis of digital twins of cities and infrastructure.
How does an organisation get started with GIS?
By first defining the question it needs to answer and auditing which data it has and which it lacks. From there, the system is designed: data sources, platform, applications and update methodology. A specialised partner like Geograma supports the whole process — starting, if needed, with a strategic consultancy that sets the roadmap — from data capture to the final viewer or application.
Shall we talk about your GIS project?
Tell us which question your organisation needs to answer. We will help you solve it with data, technology and more than 25 years of experience in geographic information.