

How can an analysis of origin-destination matrices contribute to the planning, design and operations of traffic in the neuralgic axes of a city? We present the case of the metropolitan area of Bilbao, focusing on the Rontegi Bridge. A work carried out by SyT Consultores and Geograma.
Bilbao, a key node for traffic in the Basque Country
Bilbao, until the 1990s, was an industrial city. It looked gloomy, with fumes from its factory chimneys. However, from that decade on, Bilbao began a slow and constant transformation process, becoming a smart city of services, more cosmopolitan and a tourist attraction.
This evolution and growth has turned Bilbao into a nerve center for road transport in Bizkaia and, therefore, in the Basque Country. The Department of Infrastructures and Territorial Development of the Provincial Council of Bizkaia is in charge of analyzing the distribution of trips along the main roads, as well as the origins and destinations of these movement flows between Bilbao and the surrounding municipalities.
The challenge: know the details of the traffic on the Rontegi Bridge
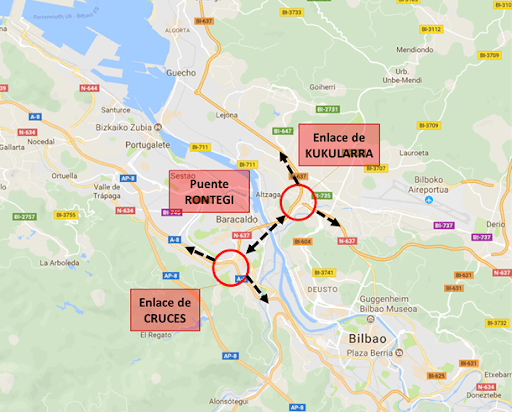
The Rontegi Bridge is one of the most sensitive road sections of the Bizkaia road network, this is due to the high traffic intensities it supports and its strategic importance when channelling and distributing traffic between the two sides of the Nervión-Ibaizabal estuary.
Since it was inaugurated in 1983, the daily traffic volume on its four lanes in each direction has only grown. The fall in traffic that was registered in the years after the financial crisis of 2009 alleviated the saturation that it had been enduring. But the economic reactivation of recent years has once again proven the lack of capacity of the only high-capacity road that connects both banks of the Nervión estuary, and that registers daily traffic of 150,000 vehicles.
Given this situation, the Provincial Council is proposing to expand the road supply with projects such as the Lamiako Subfluvial, which will connect, through a tunnel under the Ría, both banks at its mouth.
This project involves a heavy investment and long commissioning times, which is why the Provincial Council of Bizkaia is exploring smaller-scale actions to solve the problems of withholdings and delays.
With this objective, the Provincial Council of Bizkaia asked SyT Consultores to carry out a traffic study to determine in detail the demand for the Rontegi Bridge. The purpose of this study was to evaluate the impact of specific improvements in the current road network and demand management measures. They were looking for low-cost solutions to implement in the short term.
For these studies, SyT has developed a Microsimulation Model in the VISSIM software. A fundamental input in this analysis is to identify in detail the traffic that circulates through the Rontegi Bridge, not only its volume in specific sections but also in its entry and exit paths since these define the lane changes (twisted) that largely condition the functionality of the traffic.
These trajectories are usually obtained from a Macroscopic Traffic Model. In this case, the Metropolitan Bilbao Multimodal Model (MMBM), developed by SyT, has been used in the VISUM simulation platform, which has been calibrated and validated from the usual sources of information (Origin-Destination Surveys, traffic, data of Public Transport operators, etc.).
In order to give solidity to the studies, the Provincial Council contrasted in detail the results of the Macroscopic Model with real measurements made from new technologies in the area of the Rontegi Bridge.
The first step was to determine the origin and destination of the traffic of the Rontegi Bridge and the routes used to access the bridge, to contrast them with the results of the Macroscopic Traffic Model.
To do this, the use of external information from the origin-destination matrices offered by TomTom through its TomTom Move platform was considered.
The solution: define origin-destination matrices in metropolitan Bilbao
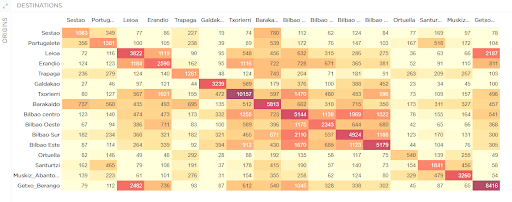
The TomTom Move platform has an added value by generating origin-destination matrices for the users of the Rontegi Bridge. These matrices have made it possible to determine the origin, destination and access routes used by users. Not in terms of absolute value, but in percentage, with a very high degree of reliability anyway.
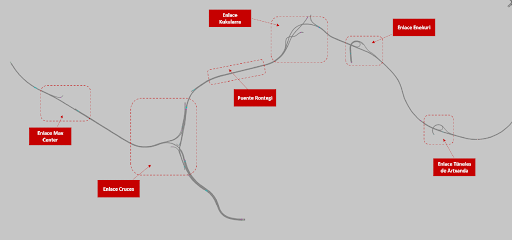
In the project, 18 zones were established (4 in Bilbao) and 26 study screens were defined in each access or exit road of Metropolitan Bilbao (AP8, AP68, N240 …) and other specific screens in the access and exit to the Rontegi Bridge (Advanced, Enekuri, Lutxana…). The months of October and November were analyzed and 4 time slots were established at peak and valley hours in the morning and afternoon.
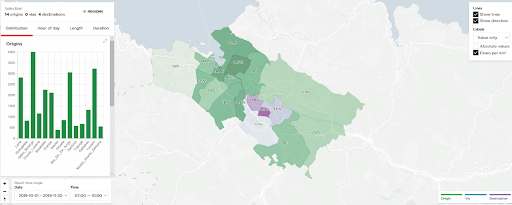
One of the deliverables consisted of a web environment in which the client could graphically analyze the number of trips and percentages of transfers made in the period studied and by time slot between zoning. Allowing, in addition, detailed analysis between a dynamic selection of areas.
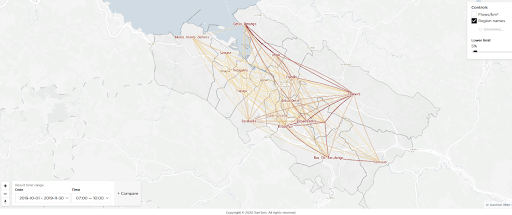
Likewise, the platform made it possible to quantify, filter and download the source-destination matrix of the project scope in editable format.
These percentages have also been combined with the volume of traffic of the gauges of the Provincial Council of Bizkaia, resulting in the construction of origin-destination matrices for the volume of vehicles of Rontegi users, according to their origin, destination and route used.
This work has been carried out in collaboration with the companies SyT Consultores and Geograma. SyT has contributed its experience in traffic and transport consulting, and Geograma as a reference company in the definition and supply of traffic services based on Floating Car Data (CDF).
What value did we bring?
The origin-destination matrices generated by Geograma have contributed to a better understanding of the traffic demand registered at the Rontegi Bridge. This knowledge was essential to achieve the objectives of the study. GPS technology has made it possible to identify the origins, destinations and routes used by users at a cost and in a time that was impossible to achieve using traditional tools.
These results have been contrasted with those obtained in the Macroscopic Model for the different origin-destination relations. A high level of adjustment has been noticed between observed volumes (TomTom) and modeled volumes (MMBM), both in daily values and in the morning and afternoon rush hours.
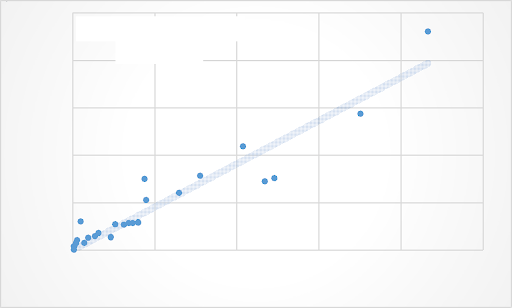
This information has made it possible to validate the results of the SyT traffic models and provide greater consistency for the evaluation of the expected impacts of the different actions on the road network that have been proposed.
These impacts have been measured, in the short and medium term, in terms of system capacity (saturation), traffic fluidity (speeds), functionality (Service Levels) and reduction of retention (queues).
The Provincial Council is carrying out the necessary Engineering studies in order to carry out actions that provide greater benefits to the road network.
Are you working on a project that requires a detailed analysis of traffic movements in your city? At Geograma we have solutions and methodologies that will allow you to extract all the value of this data. We are here to help you, feel free to contact us and tell us about your goals.