

Since traffic lights replaced human operators on the Croydon railway in England in 1842, railway signaling systems have advanced by leaps and bounds. Technology has continuously adapted and improved the way railway lines are managed, making resource optimization, reduced travel times, and enhanced safety its key differentiators.
The Mexico City-Toluca Interurban Train will transport 230,000 passengers daily. This 58-km journey will be completed in 40 minutes, compared to the two and a half hours it takes by bus. This significantly facilitates access to jobs and leisure activities between the two cities, reducing pollution and decreasing traffic accidents by approximately 400 per year. Ultimately, this service has provided solutions that lead to improved opportunities and a higher quality of life for the residents of these cities.
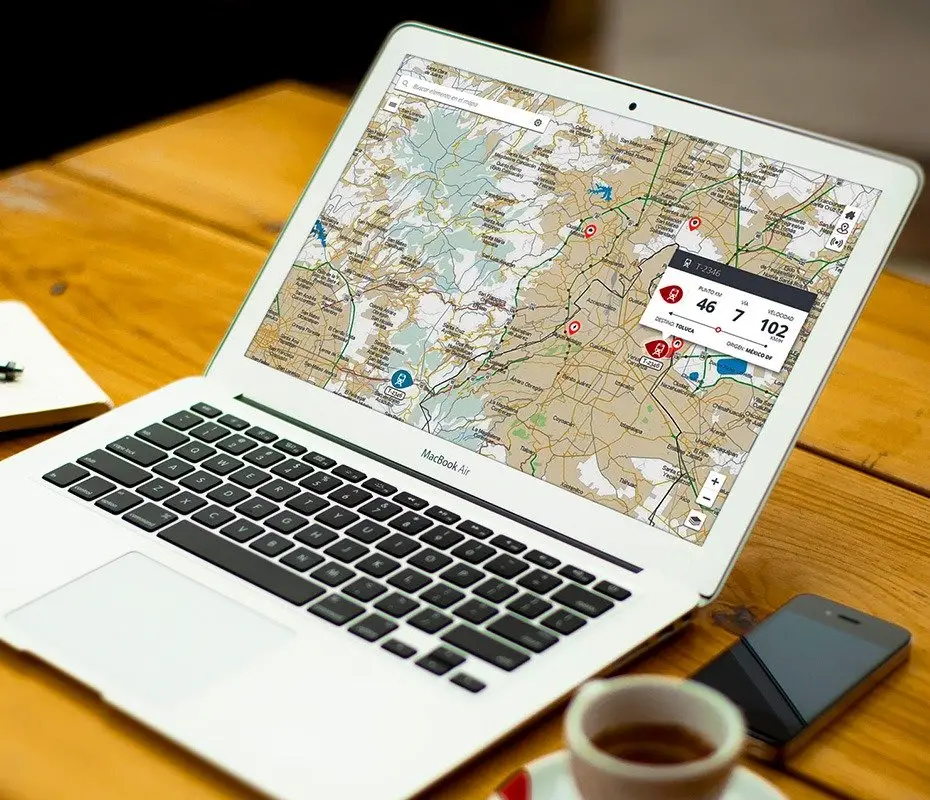
As a company specialized in GIS, we have extensive experience in the visualization and management of geographic information so that we could provide an efficient and usable solution to the casuistry that arose.
Thanks to this experience, the company CAF Signalling trusted us for the development and integration of the Geographic Information Window (GW) with the signaling systems.
In a visualization system like this one, the clarity and ease of information can be key in the management of incidents on the routes. Therefore, the main challenge was to offer a very intuitive and user-friendly tool that, integrated with the existing synoptic, would allow technicians to easily consult information regarding the location of cars, alarms, or the different signaling elements.
From the beginning of the project, the collaboration with Geograma has been a work and an experience that has brought great value to our solutions. The expertise of the Geograma team and their involvement in the development have been key to the success of the project.
Manuel Castro Viñas
Tech Leader CAF Signalling
The developed solution facilitates intelligent decision making to improve transportation in its broadest sense. To achieve the objective, the project consists of two fundamental elements:
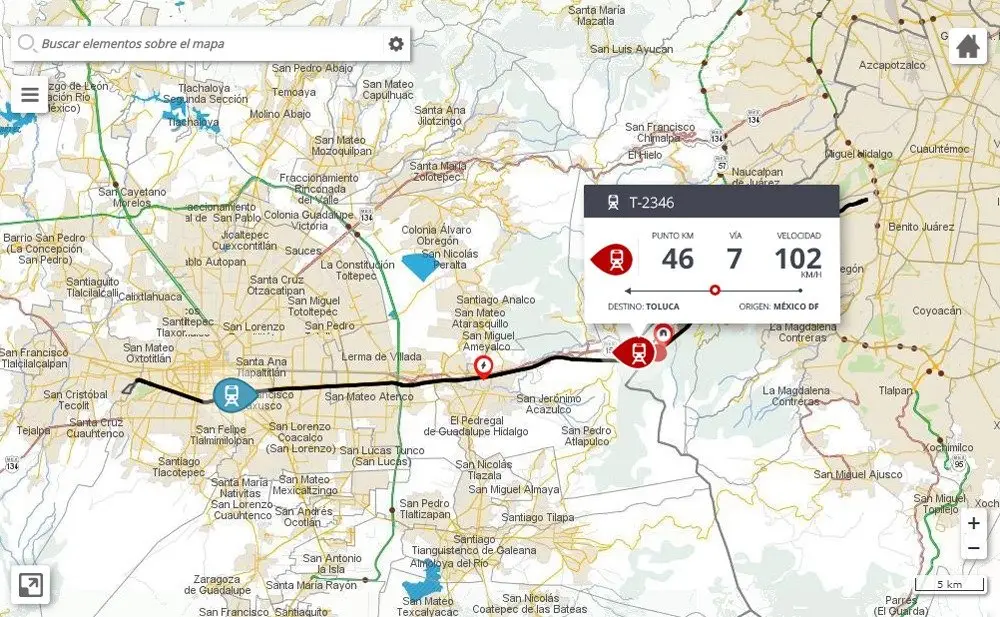
La aplicación web muestra información georreferenciada de los elementos de campo sobre una base cartográfica fija. Esta información se representa mediante capas, permitiendo al usuario mostrar u ocultar ciertos grupos de información según las necesidades de la operación.
Esta Ventana de Información Geográfica (VIG) está compuesta por los siguientes elementos:
Además, la Ventana de Información Geográfica (VIG) ofrece un API para poder establecer comunicación con el sinóptico, y así actualizar la información dinámica de la aplicación: trenes, alarmas, catenarias, etc.