
Before redesigning a road or a street, see it with real data.
We give you real traffic —not a one-off survey— so you can measure, justify and defend every decision. Based on Floating Car Data, with no fixed sensors or surveys, over full sections of the urban and interurban network.
We put the real data in your hands. The decision is yours.
We build applications and integrate TomTom's data and services to give you a reliable base of real traffic, ready for your systems —ITS, traffic-management platforms, corporate GIS. We don't do the traffic engineering or consulting: we give you the data and the tools so you, your team or your trusted consultancy can do it.
Measure the impact
Compare before and after roadworks, a signal change, an event or a new layout. Check with data whether the measure worked, instead of assuming it.
Justify the investment
Prioritise actions with historical series and Origin-Destination matrices. Bring every committee a decision backed by the network's real movement.
Anticipate the problem
Pinpoint the hot spots on your network, predict from past patterns and respond quickly to incidents and congestion.
Traffic and mobility data and services based on Floating Car Data
Millions of anonymised GPS measurements, over any area or stretch of the network and over full sections —not discrete points—, with immediate delivery.
◷ Speed percentiles and travel times
Traffic studies from historical data, for any period and any segment of your network. Ideal to assess signal changes, signage, roadworks or events.
⇄ Origin-Destination matrices
Mobility analysis that reveals travel patterns between your municipality and its surroundings, and the preferred routes between zones, without installing fixed stations or cameras.
◉ Real-time 24/7 monitoring
Average speeds, travel times and congestion across your urban and interurban networks, with confidence levels and predictions, to act immediately on incidents.
◍ Floating population
Occupancy of the floating population in your municipality, district or zoning, with its socio-demographic profile. Useful when reconfiguring urban spaces.
◉ 24/7 monitoring — in detail
Incidents
Jams, closures, roadworks and accidents, with position, delays and queue length.
Speeds
Observed real speed and travel times, ready for routing engines.
Junctions
Traffic behaviour at signals, roundabouts and approaches, in real time.
Key routes
Status and speeds of critical routes, both overall and segment by segment.
GeoTraffic: your traffic, in full autonomy
Our web GIS-Traffic platform (SaaS), combining historical and real-time information on top of TomTom Traffic Stats and Traffic Flow, so your team can query and manage the urban and interurban network and its neighbouring zonings, with no dependence on anyone.
Monitor urban mobility — check the traffic situation in real time.
Traffic and road-safety studies — historical speeds and times for predictive analysis and corrective measures.
Report repository — analyses are stored as history and compared with one another.
Preview — compare reports in a window with 4 synchronised maps.
Operate, plan and protect your road network
The same traffic data, serving the three big missions of a mobility authority.
Keep the network moving
Detect congestion, slowdowns and incidents within minutes. Improve signal and corridor performance, manage roadworks and detours, and support emergency response with reliable real-time flow and incident information.
Know where to prioritise and invest
Benchmark corridors and networks with multi-year historical series and prioritise investment from Origin-Destination matrices, travel-time reliability and bottlenecks. Evaluate the before and after of works, events and policy changes, and model long-term demand.
Anticipate and prevent risk
Identify high-risk stretches and intersections and prioritise action by exposure and severity. Support speed management with observed real speeds and compliance, and assess the effectiveness of each measure with before/after analysis.
Who we serve
National road authorities
Whole-network traffic and safety insight to guide operational and policy decisions.
Regional and metropolitan authorities
Consistent data across jurisdictions to read corridor patterns and plan ahead.
Cities and municipalities
Actionable insight from live and historical data to improve safety and ease congestion.
Traffic and mobility consultancies and engineering firms
Our clients: we give them the real data and applications to feed, calibrate and validate their studies and models.
ITS platforms, integrators and solution providers
Integration-ready traffic measures and APIs to power analytics, dashboards and support tools.
Private companies
Logistics and last mile, retail and site selection, geomarketing and insurers.
From data to decision, already in motion
24/7 monitoring for the City of Gothenburg
Together with Terratec we built the web platform the Traffic Department uses to monitor urban mobility and produce studies on TomTom's historical FCD. They combined this source with their traditional data-collection stations to improve decision-making.
«Geograma's involvement contributed very positively to a successful result.»Bodil Sundberg · Project & Marketing Manager, Terratec
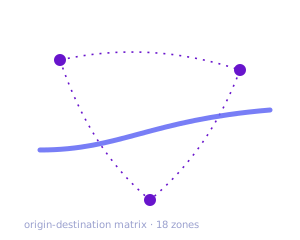
Origin-Destination matrices for the Provincial Council of Bizkaia
We provided SyT Consultores with the Origin-Destination matrices from TomTom Move and the web environment to work with them, over one of the most sensitive stretches in Bizkaia. GPS technology identified demand at a cost and timescale impossible with traditional methods, and let the consultancy validate its microsimulation models to assess actions on the network.
Official TomTom distributor and integrator, worldwide
We adopted a partner model with TomTom to build on the largest traffic database on the market. We integrate its data —historical Traffic Stats, Traffic Flow, Origin-Destination matrices and traffic density— into custom applications such as GeoTraffic, and put it, ready to use, in the hands of whoever decides.
«Our flexibility to serve a wide-ranging customer base is a direct result of our TomTom partnership.»Sergio Jorrín Abellán · Partner & CEO, Geograma
What we're usually asked
What data does Floating Car Data provide? +
What coverage does it have? +
How soon do I get the analysis? +
How often is the data updated? +
In which formats is it delivered? +
GeoJSON, JSON, KMZ, Shapefile and XLSX; area stats in GeoJSON, JSON and ZIP; O/D matrices in XLS and CSV.How much do these services cost? +
Which traffic decision are you waiting on data for?
Tell us the stretch, area or measure you need to assess and we'll propose the right study.