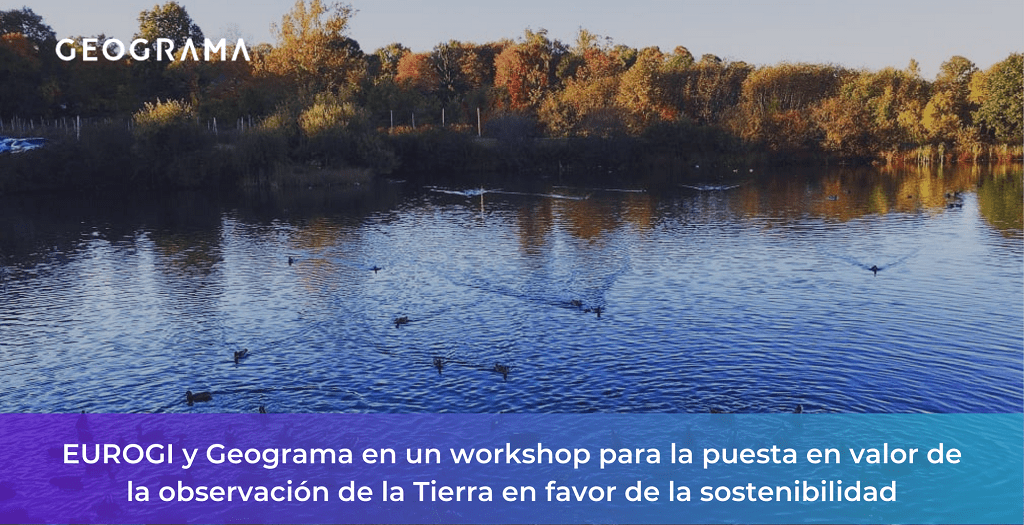
Recently, we hosted a workshop promoted by EUROGI, the European umbrella organisation for geographic information, to present and discuss some of the applications involved in the e-shape project, as well as its benefits. We bring you a summary of its content and the results achieved in the workshop.
A few months ago, EUROGI sent out a call to all its members to find out which of them would be interested in organising a workshop related to the e-shape initiative, financed by the European Union. Geograma let them know of our interest by sending a proposal that was finally accepted by this organisation.
What is the European e-Shape project?
e-shape (EuroGEOSS Showcases: Applications Powered by Europe), is an EU initiative that draws on data from the Copernicus programme to promote the development and adoption of 37 pilot applications grouped into 7 thematic areas. These address societal challenges, foster entrepreneurship and support sustainable development. These thematics are:
- Agriculture.
- Health.
- Energy.
- Ecosystem.
- Water.
- Disasters.
- Climate.
In this way, Europe is positioning itself as a benchmark in the observation of the territory, improving the assimilation of geographical data by users and its use for social progress.
How did the workshop develop?
It focused on 4 main presentations with corresponding discussion periods, as well as a final debate. We summarise what happened in each of them.
1.- Seasonal and short-range weather forecasts for Unesco cultural heritage monuments
This first presentation was given by Stavros Solomos, from the Research Centre for Atmospheric Physics and Climatology of the Academy of Athens.
The main objective of this pilot application is to provide 4-day and seasonal weather forecasts to help plan visits to Unesco cultural heritage monuments.
During the discussion period after the presentation, the following questions were raised:
- If they have some historical data to draw conclusions about climate change and see its impact. Stavros thought this was an interesting question for scientific purposes and stated that they have not yet done so. However, they are using data from the previous 20 years for seasonal forecasts.
- If they have some historical data to draw conclusions about climate change and see its impact. Stavros thought this was an interesting question for scientific purposes and stated that they have not yet done so. However, they are using data from the previous 20 years for seasonal forecasts.
2.- Satellite-based monitoring of algal blooms for reporting, management and early warning.
The second presentation was led by Annelies Hommersom of Water Insight, a Dutch company with more than 15 years of experience in using optical measurement technology to help improve water around the world.
The three main objectives of this pilot platform are:
- To offer products that provide information on the ecological status of phytoplankton biomass for the management of selected water bodies, based on chlorophyll-a concentrations derived from Earth observation data.
- Generate recognition and support for products based on spatial observation in the scope of the Water Framework Directive at political, administrative and management level.
- To take forward the recommendations made in the white paper “Satellite-assisted water quality monitoring to support the implementation of the Water Framework Directive”.
During the discussion period, issues such as the following were raised:
- A question was raised about the time between data sets that they can provide, whether hours, days or months. Annelise stated that the satellite passes every 5 days if there are no clouds. When the satellite image arrives, usually in the morning, the image can be ready that evening. This is all free data, as it can be quite costly if the satellite needs to be programmed for specific purposes. Sentinel 3 images are available every day, but with lower resolution.
- It was noted that sometimes waiting 5 days can be catastrophic and a significant loss of product can occur in aquaculture. Annelies stated that the information from the two satellites is combined with 5-day and 1-day round trips, so the alert can arrive faster. Annelies also stated that it is possible to combine the data model with the weather forecast to make algae predictions for the coming days.
- It was asked whether the model can be applied with local specificity and at a reduced cost, so that local producers can afford it. Annelies affirmed that the model can only be exported to areas with similar characteristics.
3.- Rheticus Aquaculture: Satellite monitoring service for smart aquaculture
The third presentation was on satellite monitoring service for smart aquaculture. It was given by Alessandra Bleve, from an Italian-based company with more than 27 years of experience in providing solutions to exploit the value of geospatial data in all phases of its life cycle.
The main objectives set for this pilot are:
- Design the code for a sustainable, improved and enriched service for aquaculture.
- Extending the global adoption of this service.
- Exploit the federated DIAS with the proprietary Rheticus® platform and thus take full advantage of Copernicus data.
- Share and support the Sustainable Development Goals (SDGs) and FAO’s vision for sustainable food and agriculture.
During the discussion period the following issue was brought:
It was pointed out that aquaculture products need to have a specific model that predicts when the products will be marketed. It would be perfect to find a balance between what the market needs and what is available in the sea.
Producers need not only environmental and biological parameters, but also economic and marketing parameters.Therefore, a question was raised:
- Is it possible to produce such a model? Knowing the market variation will help determine the price. Alessandra stated that it can be done, but not now. However, Rheticus may know how to arrive at such a solution.
4.- Simple water visibility information for dive planning for scuba diving
The final presentation was given by Simeon Wilkinson of the UK-based research organisation Plymouth Marine Laboratory.
The main objectives of this pilot are:
- Provide a near real-time visibility score for specific dive locations.
- Populate and enhance a coastal database of dive sites.
- Increase awareness of the benefits of Earth observation data to the wider community.
During the discussion period, the following issues were raised:
- It was said that some pilots could combine their efforts for an important purpose, as many of them work on related issues. So is it possible to include different criteria in this system? Simeon said it might be possible, but it was more a matter of transporting that new information within the application itself.
- There is an EU plan to develop shellfish farming for safety and food security reasons. It was noted that having an application that provides information on what is happening in the open sea (offshore) will be more than useful in this regard.
Final group discussion
The workshop concluded with an interesting debate in which certain reflections related to aquaculture were put on the table, such as the following:
- Each local and national association has its own specific needs. Paradoxically, they are not interested in a local approach, as they know the local conditions by heart, but in a global approach. In other words, to know the temperature of the water in their fish farm, they use a thermometer, but they cannot relativise the reading they take. For example, if some shellfish are harvested at X degrees, are they the only ones or is it the same for all harvests? If they had that information, they could get numbers, such as total production, market price, etc.
- Data was provided on the seafood sector: In the EU there are 7500 farmers, 50% are family farmers (1-2 persons), the remaining 50% are larger but still relatively small. In France there are 2500 companies, but only 200 have more than 1 million turnover and 1000 less than 100k. In Spain there should be more or less the same figures. This means that there are thousands of potential customers.
- Farmers need to go offshore, which is more complicated than for nearby farms, and they need tools to not go there every day. On nearby farms they go and look at it, offshore it’s not so easy, so Copernicus can bring a lot of value. They need predictive and forecasting systems for offshore marine development. They say they don’t care how the tool works (cameras, satellites or sensors). Farmers just want the tool. Their knowledge is empirical and managers are over 50 years old, so the time to develop the right tool is in the next few years.
- As a result of the above discussion, it was suggested to collaborate on a Horizon Europe.
- A recommendation was made for the pilots: put market numbers in the presentations and when targeting potential customers.
- The need to take follow-up actions after such interesting discussions was expressed.
With this enriching debate, we brought to an end an event from which both the participants and the organisers benefited greatly. Of course, we will keep you up to date on the next ones where we will be present. Stay tuned and don’t miss them.