
Integrated water cycle · River basins and water risk
GIS inventory of water supply and sewer networks
Know the network you manage. We survey water supply and sewer networks asset by asset, structure them into a standardised data model and leave them running inside your corporate GIS. At the level you need: to manage your assets, or so your engineering team can design and model the network.
- Data model standardised per network and municipality
- Precise base mapping, above ground and below it
- PostGIS database and corporate GIS project
- Two-level inventory: management and modelling
- Water supply
- Sewerage
- Inventoried assets
Astigarraga Town Council describes the outcome of the project as “a complete, accurate and consistent digital inventory of our networks”.
Imanol San SebastiánHead of municipal services, Astigarraga Town Council
Integrated water cycle, river basins and water risk
Geospatial solutions for managing the integrated water cycle, river basins and water-related risk: from municipal assets and networks to planning, monitoring and territorial management at basin scale.
They are managed in two areas that fall under two separate remits, by different people, with one shared precondition: knowing what is there and where. The first is the network already built. The second is what is about to happen to the water on its way.
Area 1
The network: water supply and sewerage
Knowing the buried asset in order to operate it better: locating a leak sooner, knowing which valves have to be closed and who that leaves without service, measuring where water is lost and deciding on evidence which stretch gets renewed first.
- Asset-by-asset inventory, georeferenced, photographed and with a record
- Shut-off simulator: which valves to close, which sectors go dry and which critical assets are inside
- Service connections cross-checked against consumption to detect leaks and unregistered connections
- Material and condition, plus installation year where it appears in existing records, to prioritise pipe replacement
Town councils and municipal water departments, publicly owned utilities and private operators running the service on the council's behalf.
Area 2
Water in motion: anticipation
Moving from reacting to anticipating: estimating what floods and who it affects, and detecting a discharge from the behaviour of the signal rather than from a later inspection.
- Flood scenarios and exposure: dwellings, population and critical facilities
- Anomaly detection on time series from automatic monitoring stations
Water agencies, river basin authorities and administrations responsible for flood risk and for the quality of water bodies.
With the same data we help town councils, service operators and river basin authorities face ageing networks, water losses and climate risk. The projects further down evidence the first area and the work with river basin authorities. The models of the second are built on exactly the same data: without a governed inventory there is no model worth having. Artificial intelligence amplifies data quality in both directions, which is why the inventory comes first and the model second. More on this in what is a digital twin.
A two-level inventory
An inventory that grows with your needs
Not every utility needs the same thing on day one. That is why we structure the inventory on two levels: the first lets you manage your assets; the second lets your engineering team design changes to the network or build its hydraulic model.
Level 1
Asset inventory (GIS)
Know which assets exist, where they are and what their main characteristics are.
- Location
- Asset type
- Material
- Nominal diameter
- Installation year, if on record
- Condition
- Photographs
- Notes
- Accessibility
- Approximate depth, where available
“There is a DN400 concrete sewer running roughly from this manhole to that one.”
Lets you manage your assets.
Level 2
Model-ready network inventory
Know how the assets are connected and have the geometry, levels and connectivity at the quality needed for the network engineering model or the hydraulic model.
- Everything in level 1
- Geometry
- Invert levels
- Depths
- Gradients
- Connectivity between elements
“This DN400 sewer connects these two manholes, enters at an invert level of 542.36 m, leaves at 541.82 m, is 74.3 m long and has a gradient of 0.73%.”
Provides the geometric and topographic base an engineering firm needs to design works or build a hydraulic model.
“With this geometry, these flows and these rainfall conditions, the sewer reaches 87% full and surcharges downstream.” The hydraulic model is built by engineering firms and water operators, who are our clients, on top of the level 2 inventory.
Scalable. You can start with level 1 and complete level 2 when you need it, across the whole network or only in the sectors that require it. We do it on the same data model and reuse what has already been captured: we only go back to the field for what is missing.
Illustrative examples; the values do not correspond to a real network.
Why Geograma
A network inventory is not won at a desk. It is won by lifting covers, measuring what is actually there, and deciding beforehand how it will be stored.
We capture the data ourselves
We do not subcontract the hard part. Field survey on foot, Mobile Mapping of the street network, terrestrial laser scanning, LiDAR drone and 360º camera in manholes. If the asset is buried, we go and get it. And first of all the base mapping: if it does not exist at the accuracy the job needs, we survey it ourselves.
We structure before we draw
Every network and every municipality starts with a data model: entities, attributes, domains and consistency rules agreed with the water department. Without that, an inventory is a nice drawing that expires in two years. And we design it from the outset to take level 2: extending the inventory never means redoing it.
We leave it running at your place
Starting from scratch, we work with open-source software — PostGIS, QGIS and web viewers — so there is no licence cost and no vendor lock-in. Where a corporate architecture already exists, we build within it rather than impose our own. Either way we train your staff: the system has to live in your organisation, not in ours.
Geograma does not do hydraulic engineering or network modelling: we do not calculate pressures, size pipes or write master plans. The engineering firms, consultancies and water operators that do that work are our clients, never our competitors. We capture the data and produce the inventory that lets them design and model.
What we offer
The full data cycle for a network: from the asset in the street to the database several departments query.
Survey and inventory
Water supply and sewer network inventory
Pipes, valves, hydrants, manholes, chambers, registers, tanks and pumping stations: identification, location, categorisation and coding of every asset, at the level you need: asset inventory or model-ready network inventory.
Standardised data model
Defined per network and per municipality, with domains and a data dictionary, so the information is comparable, auditable and extensible.
Mobile Mapping of the street network
A vehicle with positioning sensors, 360º cameras and a 3D scanner: thousands of photographs and millions of points to position visible assets before the on-site inspection.
Underground capture
LiDAR drone for inaccessible conduits, terrestrial laser scanning at the openings, and a proof of concept with a 360º camera in manholes to digitise the network with its true geometry.
System, publication and maintenance
CAD to GIS migration and PostGIS database
Transformation, cleaning and loading of heterogeneous legacy inventories into a single, operational spatial database.
Corporate GIS project and training
A multi-department project on QGIS, with defined update workflows and training for municipal technical staff to ensure real adoption.
Automatic PDF records and web publishing
Automatic generation of one record per inventoried asset, a WebGIS viewer for management and transparency, and GeoCassini to exploit point clouds without specialised software.
Precise base mapping and compliance
The base the inventory rests on: precise municipal base mapping with a maintenance plan — surveyed with Mobile Mapping and LiDAR where it does not exist — official ETRS89 and REDNAP08 reference systems, and SafeMoMa to anonymise faces and number plates under the GDPR.
Shut-off simulator
When an incident occurs, calculation of the isolation polygon: valves to close, sectors affected and critical assets involved, in seconds rather than over a paper drawing.
Indicator dashboard
Inventory, data quality, management and SDG indicators, each with its source, calculation rule, update frequency and cartographic representation defined.
How we work
Five stages. The order matters: the data model comes first, because it is what turns a field campaign into a system that can be maintained.
Data model
Entities, attributes, domains and consistency rules, agreed with the water department before going into the field.
Capture on precise base mapping
The inventory rests on the municipality's precise base mapping. Where it does not exist, we survey it: Mobile Mapping of the street network — photography and scanning of the public highway — together with a LiDAR survey. That is the best base for positioning manholes, gullies and network assets in XYZ, accurately enough to find them on site and to analyse them afterwards. On top of it: collection of existing drawings and sources, and survey on foot — lifting covers, measuring and photographing every asset.
Characterisation and quality control
Every asset georeferenced, photographed and with a record. Quality is measured: percentage georeferenced, with a photograph and with a complete record.
Migration and deployment
CAD to GIS conversion, loading into PostGIS and a corporate GIS project accessible from several departments.
Publishing and maintenance
Web viewer, PDF records, open-trench network maintenance documentation, training and update campaigns.
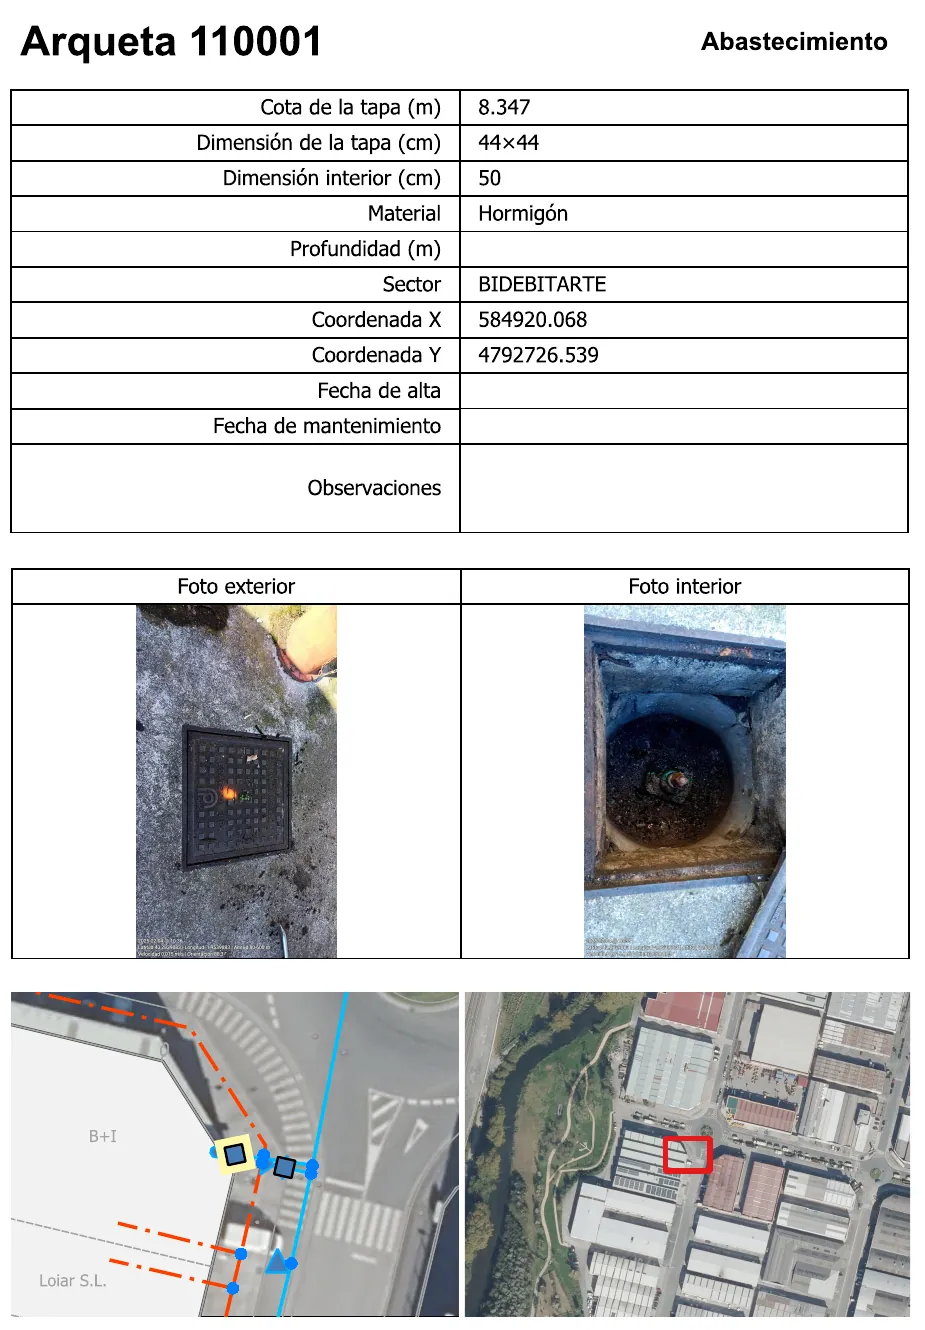
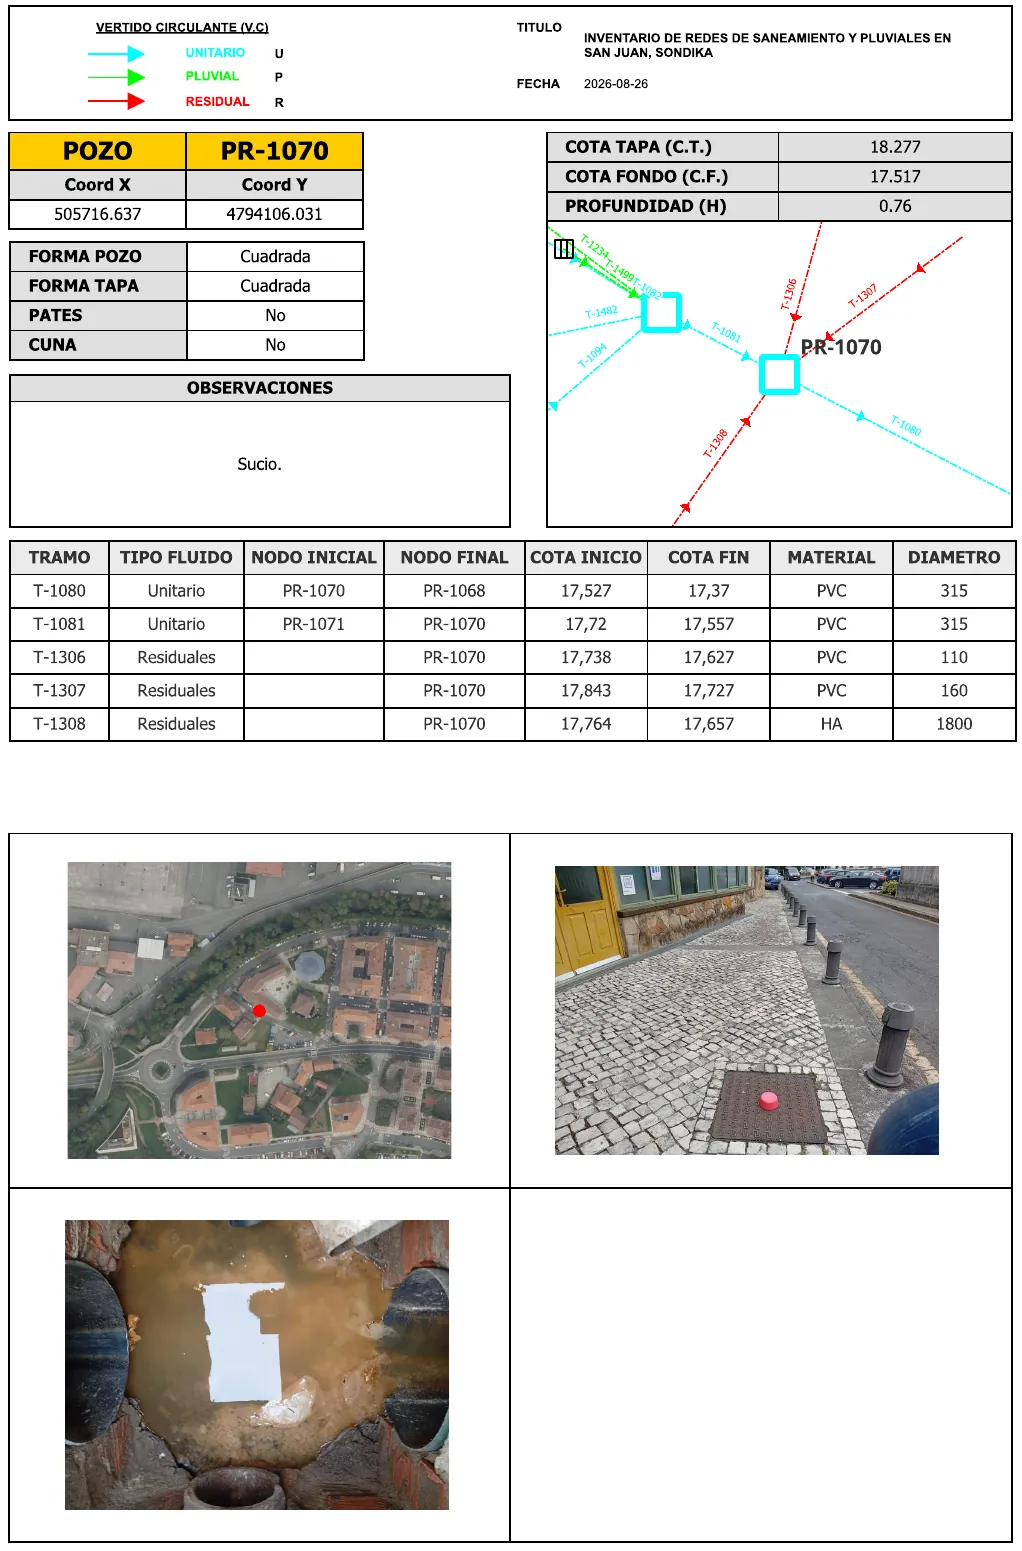
Real records produced by Geograma. Click to enlarge.
The platform in operation
From the map to the operational decision
GeoCABB is the corporate WebGIS platform with which the Bilbao Bizkaia Water Consortium operates and maintains the urban water cycle. It brings into a single environment the geospatial information of the water supply and sewer networks and of the associated electrical distribution, integrates with the consortium's corporate database and provides access from any device with integrated authentication and role-based permissions.
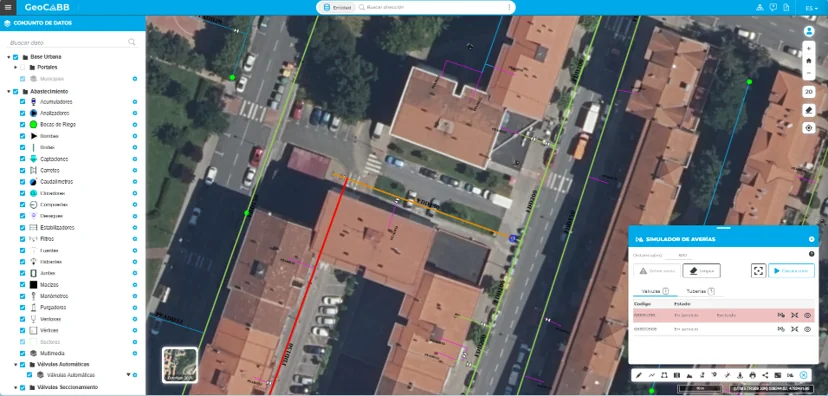
Its most cited function is the shut-off simulator: when an incident occurs it computes the optimal isolation polygon and automatically identifies the valves to close, the sectors left without service and the critical assets involved. What used to be worked out on a paper drawing and from memory is now resolved while the crew is on its way.
- Integration with the corporate database and role-based permission control
- Open services and APIs to connect with corporate systems, emergency services and third-party applications
- 3D BIM visualisation, funded by Next Generation EU, bringing the infrastructure model closer to the geospatial data
- The base on which future digital twin scenarios for the urban water cycle will rest
GeoCABB is built on GeoBAT, a collaborative initiative between public administrations that promotes the reuse of geospatial software and the shared development of features across town councils, provincial authorities, consortia and public bodies. The model cuts costs and favours interoperability, because what one administration develops the next one can reuse.
The viewer
Where the inventory gets used every day
An inventory stops being a file the day it opens in a browser. We have deployed that piece at three scales: a joint water authority, a town council and a regional water agency. Underneath, always the same: a desktop tool for maintenance and a web viewer shared with whoever has to use it.


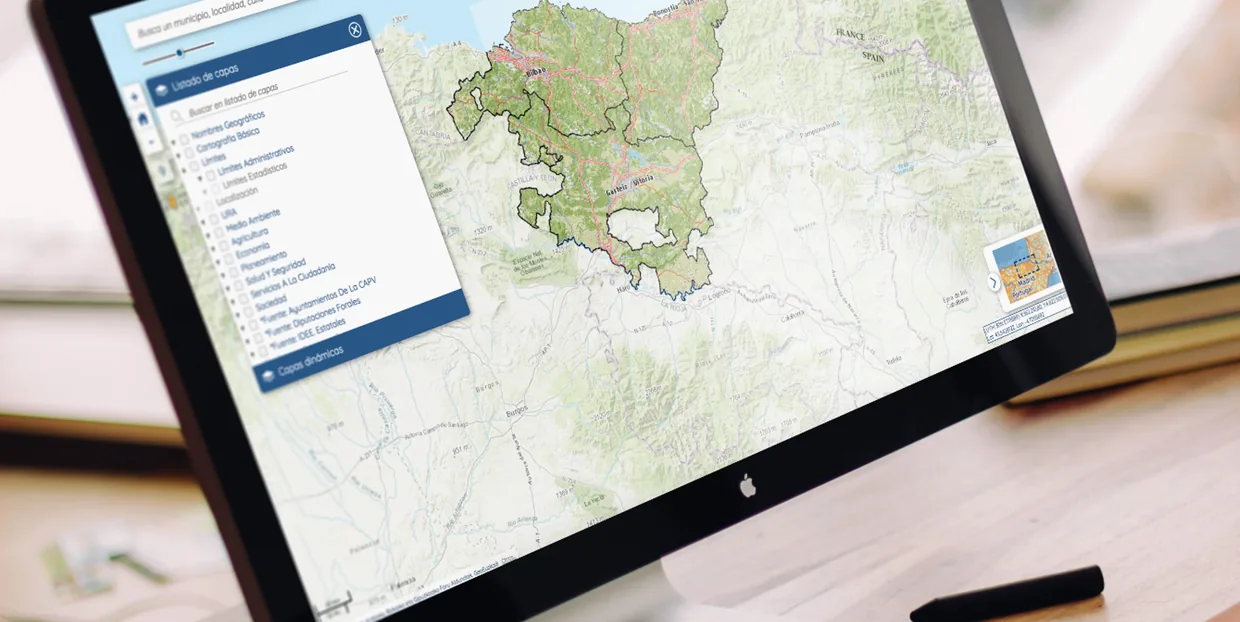
Three modules
Map
Display of georeferenced assets, measurement tools, two base layers overlaid at once, and loading of your own layers in Shape, KML, GPX and other formats.
Search
Alphanumeric queries on the assets registered in the system.
Asset record
Full, detailed information on every inventoried asset.
- QGIS desktop tool for network maintenance
- Corporate viewer on the intranet, shared across the authority and its municipalities
- Responsive design: the same viewer on the office computer and on the field crew's phone
- Modular composition, extensible to new needs
Real projects
Six water projects, with their scope and their results. Cards with a link point to their public source.
GeoCABB, corporate web GIS and sewer inventories
The largest water cycle operator in the Basque Country, responsible for the primary supply and sewer network serving close to a million people in Bizkaia, has worked with Geograma since 2022: first on the technical assistance for its corporate web GIS, today GeoCABB, and since January 2026 also on producing the inventories of its sewer networks.
- GeoCABB corporate WebGIS platform, with a shut-off simulator
- Corporate web GIS technical assistance since the 2022 tender
- Sewer inventories: contract formalised on 19 January 2026
- EU-regulated tender, published in the Official Journal of the EU
New corporate geographic viewer
Analysis, design, construction and deployment of a new GIS application for the Basque Water Agency: a viewer built on GeoEuskadi with corporate security, feature editing and web services, replacing the agency's previous intranet viewer. Commissioned by EJIE, the Basque Government's IT company.
- Delivered between June 2024 and June 2025
- Corporate authentication with query, editing and administration profiles
- Bilingual interface in Basque and Spanish
- Viewer embedded within five of the agency's business applications
Redesign and migration of the Water Points Inventory (IPA) application
The Ebro river basin authority maintains the Water Points Inventory, the groundwater points database of its Hydrological Planning Office. Geograma redesigned the application that manages it and migrated its information.
- More than 36,000 groundwater points, according to the basin authority
- Data from the authority itself, from the Spanish Geological Survey and from university research
- Available through the authority's geoportal and downloadable as a layer
GIS asset inventory of water supply and sewer networks
Three town councils with heterogeneous CAD and GIS inventories of differing accuracy and structure. A data model was defined per network and municipality, capture was carried out with Mobile Mapping, the information was migrated to GIS and a multi-department corporate project was deployed with QGIS training.
- 15,602 devices inventoried, 13,294 characterised by Geograma
- 170 km of supply network and 172 km of sewer network documented
- 9,452 PDF records for sewer assets and 6,150 for supply assets
- Fully operational PostGIS spatial database
Sewer network inventory and geographic information system
Siero Town Council set out to modernise the management of its sewer networks through an inventory of the municipal networks and the development and deployment of a GIS. Data collection relied on Mobile Mapping: photography and 3D scanning of streets and tracks to position visible assets before the on-site inspection.
- Thousands of 360º photographs and millions of scanned points
- Inspection and measurement at survey accuracy from the office
- Fewer site visits and greater safety for technical staff
3D capture and modelling of a buried stream
Capture, modelling and 3D geometric analysis of a stream culverted beneath roads and buildings, to obtain a reliable technical base and integrate it into the municipal mapping.
- LiDAR drone inside and Leica RTC360 scanning at the openings
- Longitudinal profile and cross sections every 20 metres
- Web query and analysis through GeoCassini
Servicios de Txingudi – Txingudiko Zerbitzuak, the water operator for Irun and Hondarribia, has been a Geograma client since 2011: survey work to obtain the coordinates of the sewer network in both towns, and Mobile Mapping capture of both urban areas.
Who we work for
Town councils and municipal water departments
Those who own the network and must maintain it, often with small teams and a great deal of undocumented buried infrastructure. And that also need publishable indicators for their local action plan.
Publicly owned utilities and service operators
Public, mixed or private management running the service on the council's behalf, which needs to know the assets it operates and track their condition.
Water agencies and river basin authorities
Responsible for planning, flood risk and the quality of water bodies, with a constant need to combine sources that do not talk to each other.
Water consultancies and engineering firms
We survey the inventory their hydraulic models, renewal projects and master plans start from.
What the law already requires
Managing water in Europe is, first of all, an obligation with a timetable. The Water Framework Directive established the river basin district as the unit of management and good status of water bodies as a legal objective, through cyclical planning reviewed every six years. The Floods Directive added a cycle of its own: preliminary risk assessment, hazard and risk maps, and management plans, also reviewed every six years.
River basin authorities
Spain's confederaciones hidrográficas administer basins extending beyond a single autonomous community. The consolidated Water Act assigns them the drafting, monitoring and review of the river basin management plan, and the administration and control of the public water domain.
Regional water administrations
In internal basins the competence is regional. In the Basque Country, the 2006 Water Act created the Basque Water Agency as the central instrument of water policy, with planning duties, protection of the public water domain and binding reports on municipal planning.
Town councils and service operators
Water reaches citizens through the municipality. Supply, sewerage and the network behind them are a local responsibility, whether the service is provided directly, through a publicly owned utility or by a private operator.
Every review means delimiting, characterising, measuring and justifying all over again. All of it rests on geographic information, so the operational question always ends up being the same: where is it, what condition is it in, and who can prove it.
2030 Agenda
From the inventory to the 2030 Agenda indicators
A network inventory is not only an operational tool: it is the quantitative basis of a local action plan. The same data used to locate a leak answers what share of the network is over fifty years old (where installation dates are on record), which assets sit in a flood zone, or what proportion of the population is served by a fully surveyed network. These are impact questions, which is precisely what funding calls reward.
The indicator framework, in four blocks
- InventoryKilometres of network and number of assets.
- Data qualityPercentage georeferenced, with a photograph and with a complete record.
- ManagementRenewal index, condition index, failure risk and service coverage.
- SDG indicatorsResilience, transparency, climate adaptation, service quality, accessibility and sustainability.
Correspondence with the Sustainable Development Goals
The public viewer closes the loop: the same data serves twice, for the technical team's daily management and for transparency towards citizens. It is the municipality's 2030 Agenda shop window, and its use is measured too.
And it can be funded
Spain's calls supporting the 2030 Agenda in local authorities, governed by Order DSA/632/2022, fund projects of this profile. In parallel, according to Spain's Ministry for the Ecological Transition and the Demographic Challenge, the PERTE for water cycle digitalisation is expected to mobilise 3.06 billion euros in public and private investment. Ask us which part of the project fits the call you have open: we prepare the technical report and the budget.
Frequently asked questions
We have no drawings of the network. Can you still inventory it?
Yes. We start from whatever exists — GIS projects, CAD, PDFs, paper drawings or the knowledge of the maintenance crews — and the fieldwork fills the gaps. Missing documentation is the usual starting point, not an obstacle.
Do we have to change software or pay for licences?
It depends where you start. If nothing is in place, we work on QGIS and PostGIS, both open source, so there is no recurring licence cost and no vendor lock-in. If you already have a corporate architecture, we develop within it and respect your security and integration standards. What we will not do is force you to change platform in order to work with us.
How do you document what is buried?
In three ways. Accessible assets, by lifting covers and measuring on foot. The street and its context, with Mobile Mapping. And inaccessible conduits, with a LiDAR drone and terrestrial laser scanning at the openings, or a 360º camera in manholes.
What exactly do we receive at the end?
A PostGIS spatial database with the networks and their assets, a corporate GIS project, PDF records per asset, updated mapping, maintenance documentation and training for the technical team.
Can the inventory be used to design works or build a hydraulic model?
It depends on the level. The asset inventory (level 1) is for managing the network: what is there, where it is and what condition it is in. To design an intervention or build a model you need the model-ready network inventory (level 2), with invert levels, depths, gradients and connectivity of sufficient quality. You can start with level 1 and complete level 2 later, across the whole network or sector by sector. The design and the model are produced by engineering firms, which are our clients.
Do you build water digital twins?
We build the base a digital twin rests on — the inventory, the data model and the GIS — and we develop the scenario, exposure and anomaly detection models on top of it. The hydraulic model is built by your engineering team on top of the level 2 inventory.
Our service is run by a private operator. Can you still work with us?
Yes. We work both for the town council that owns the network and for the publicly owned utility or private operator running the service. The one thing worth agreeing at the outset is who owns the data at the end: our recommendation is always that the inventory remains the owner's asset.
Can this project be submitted to a 2030 Agenda funding call?
It fits well, because these calls reward impact rather than activity alone: an inventory produces measurable indicators, leaves permanent infrastructure in the municipality and is justified with verifiable deliverables. We can prepare the technical report and the budget; the submission itself is made by the council.
Tell us which network you need to know
Send us whatever you have — drawings, CAD, GIS or nothing at all — with the municipal area and a rough idea of the kilometres of network. We review your current inventory and tell you which level you need, with scope and method.